
Agritask
insurance
platform
insurance
platform
A sub-product by Agritask that was raised out of the difficulties and lack of knowledge insurance companies deal with when insuring agricultural areas and farms in large scale.
Crops and yields are subject to many risks that are an outcome of unpredictable weather and climate conditions, which may cause enormous losses. Agritask can analyze past events to predict risk levels in order to create custom insurance policies according to geographic location.
The users
Underwriters in insurance companies, located mostly in Africa.
The issue
Underwrites struggle to assess certain areas risk levels and must evaluate mass amount of historical data (past wether and previous local disasters) in order to create a custom policy to growers who hold fields in many hectares and locations.
The solution
Agritask created a platform that can analyze in real time geographic locations (polygons) and evaluate the amount of risk a certain area is exposed to.
This tool for underwriters allows them to estimate the cost of the policy and the payback in case of emergency.
Wireframes

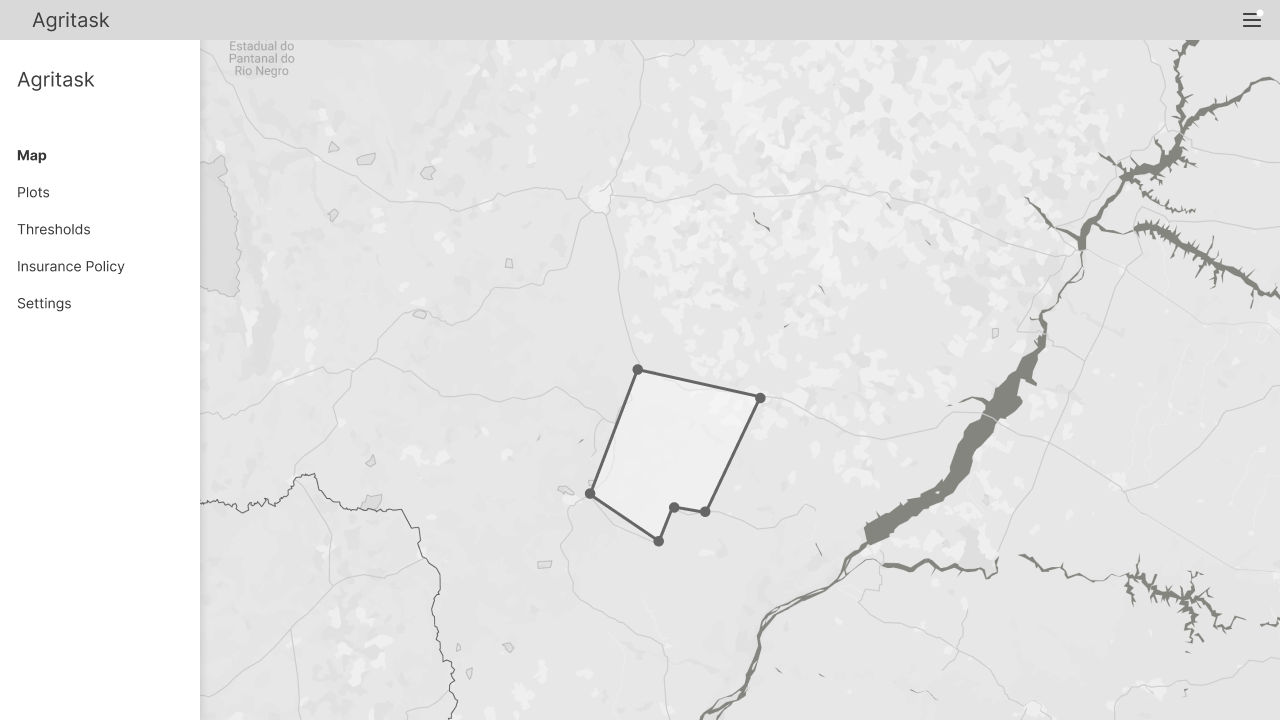

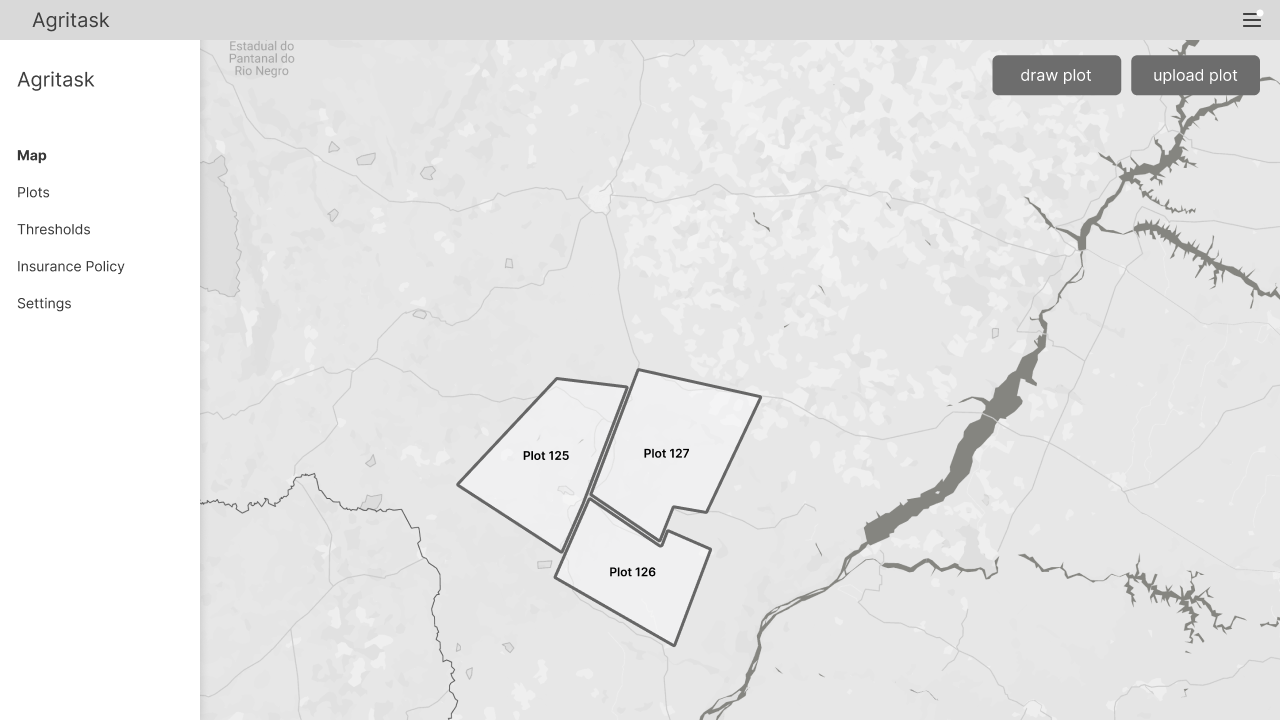
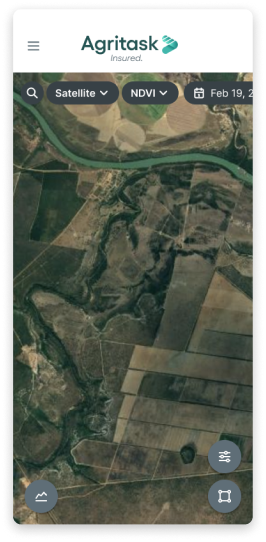
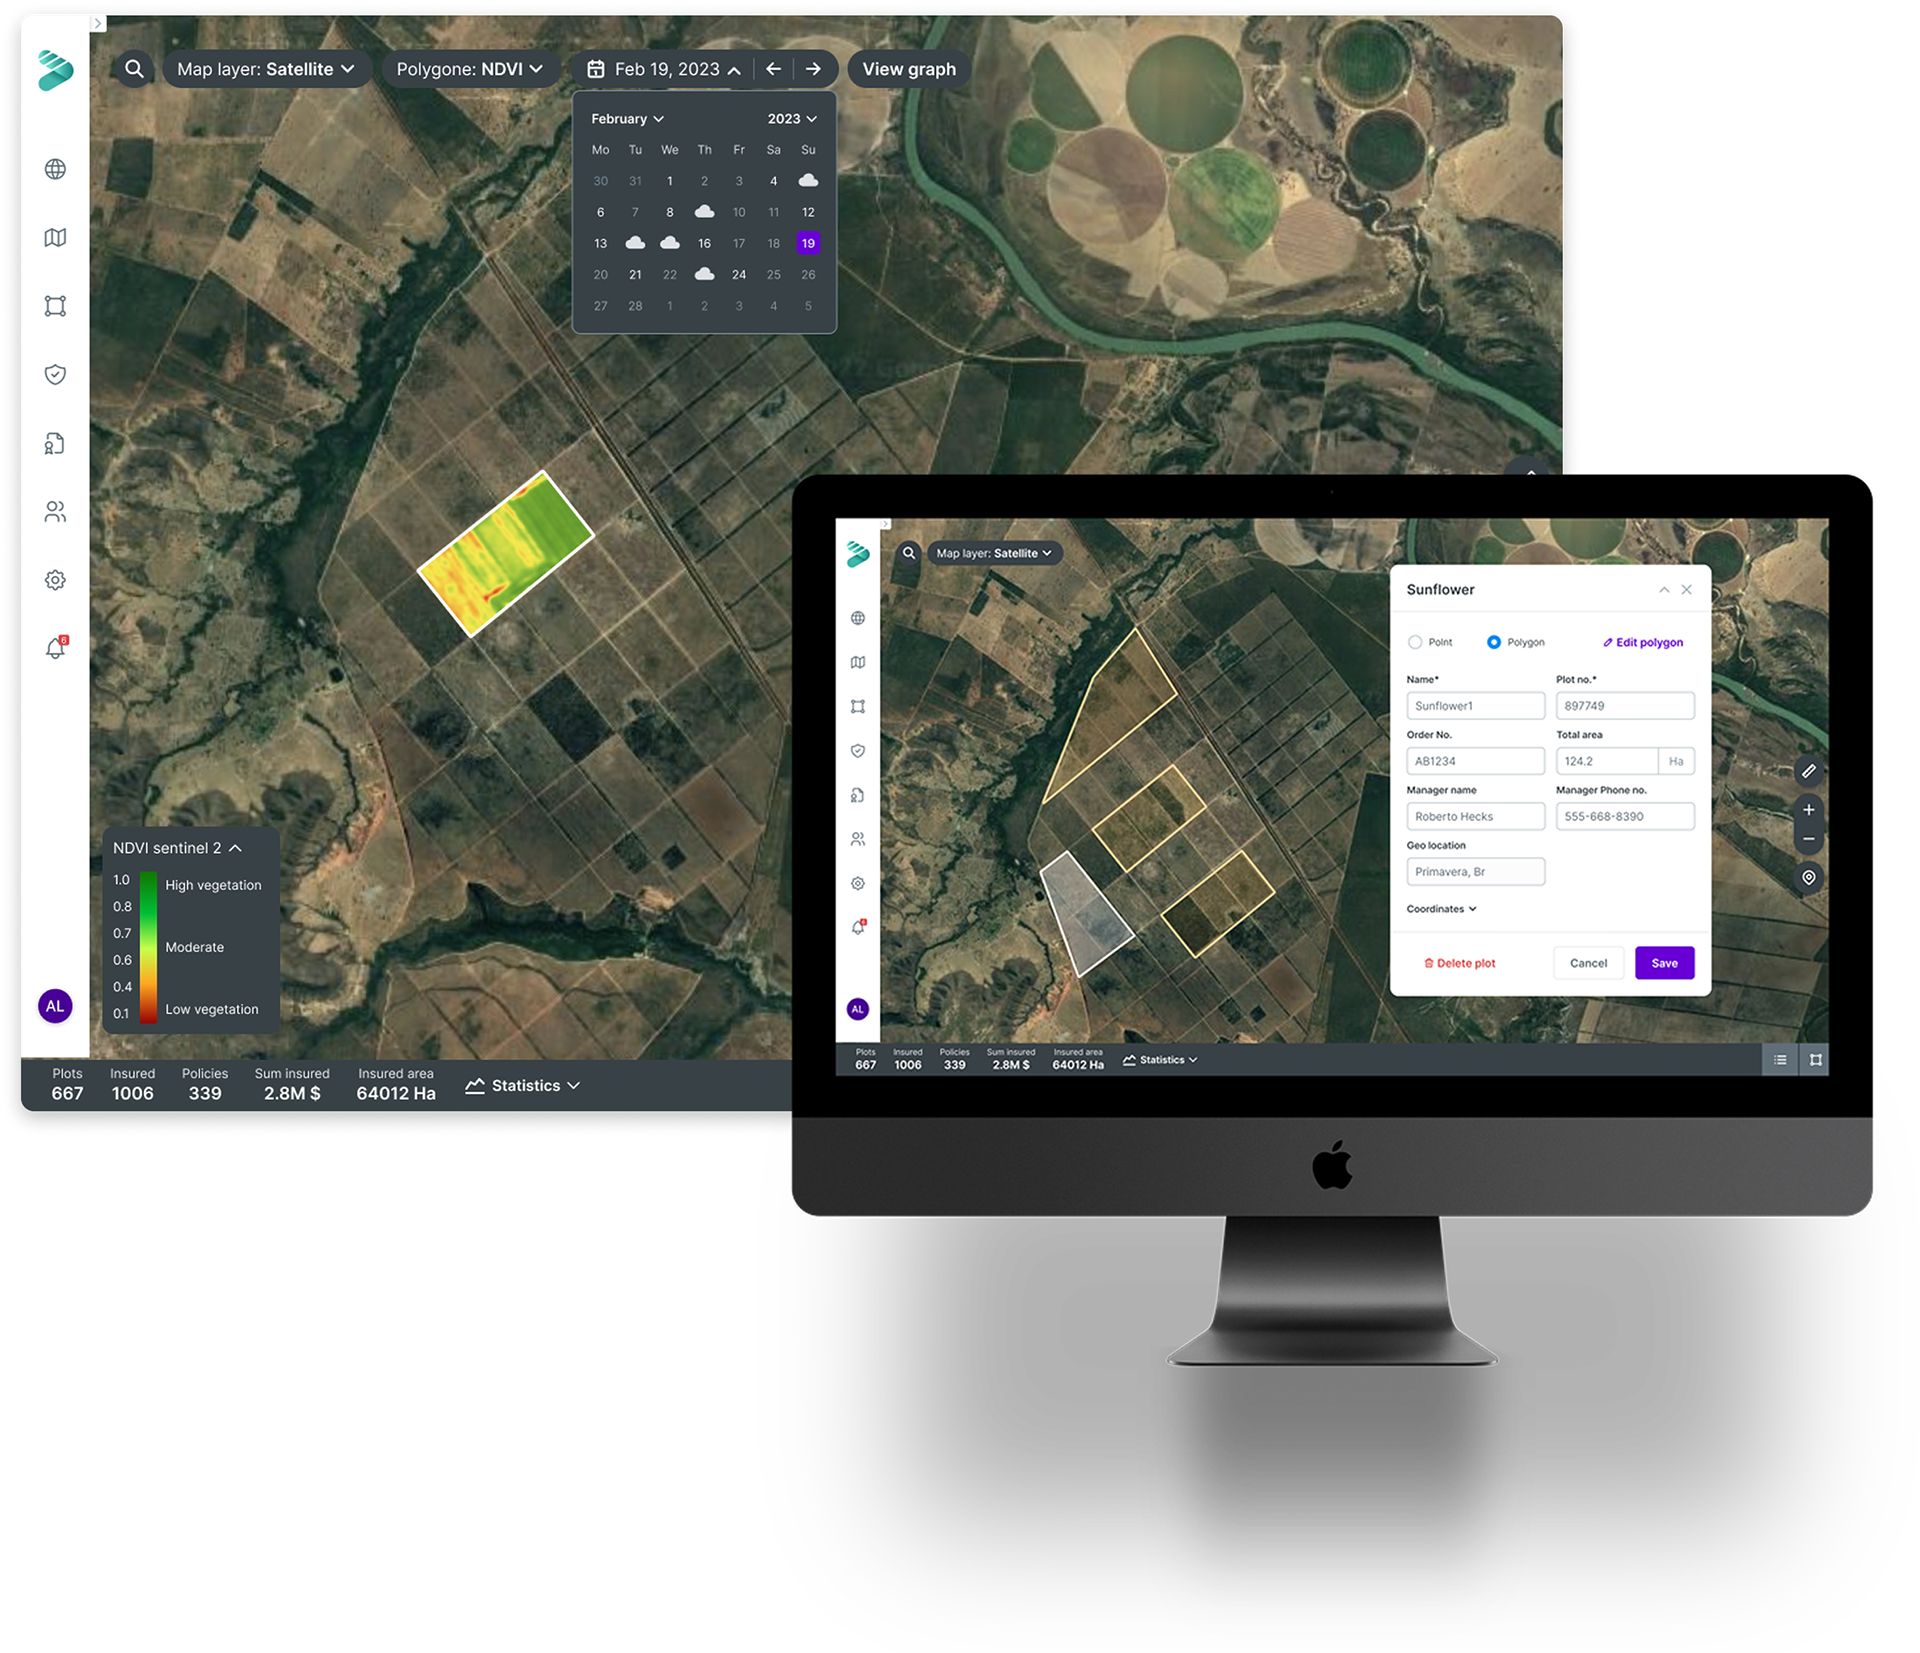
Map view
preforms as the main screen - allows adding polygons and receive historical data per polygon. Available data includes historical weather, soil type and NDVI image
(vegetation level).
(vegetation level).

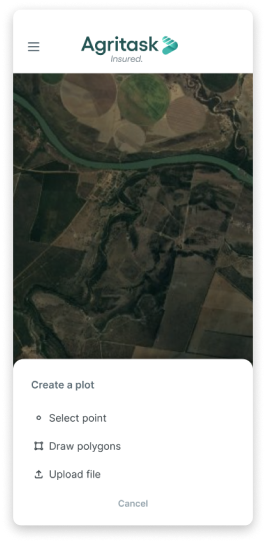
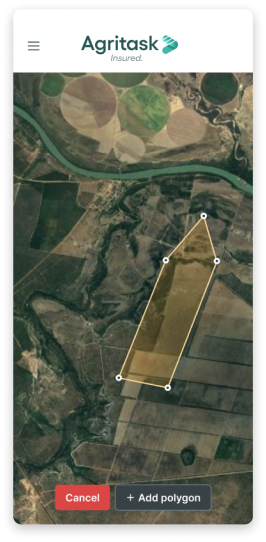
Create new polygon

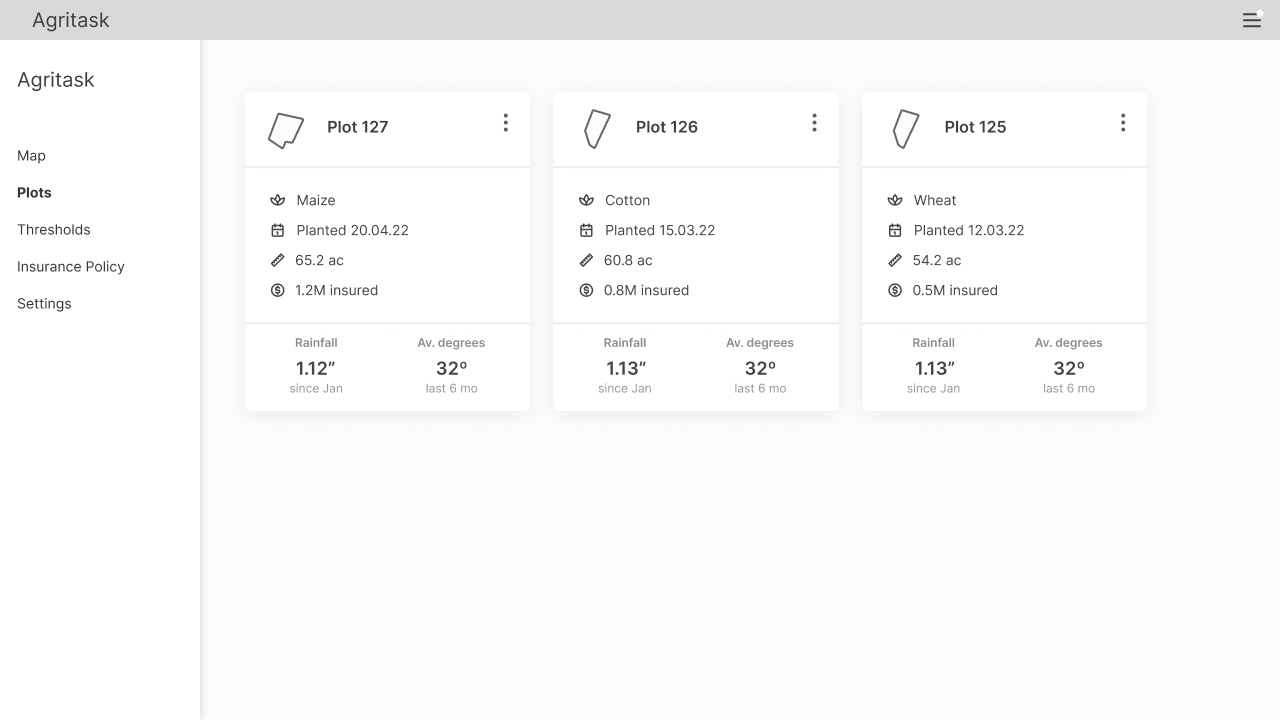
Plot summary page
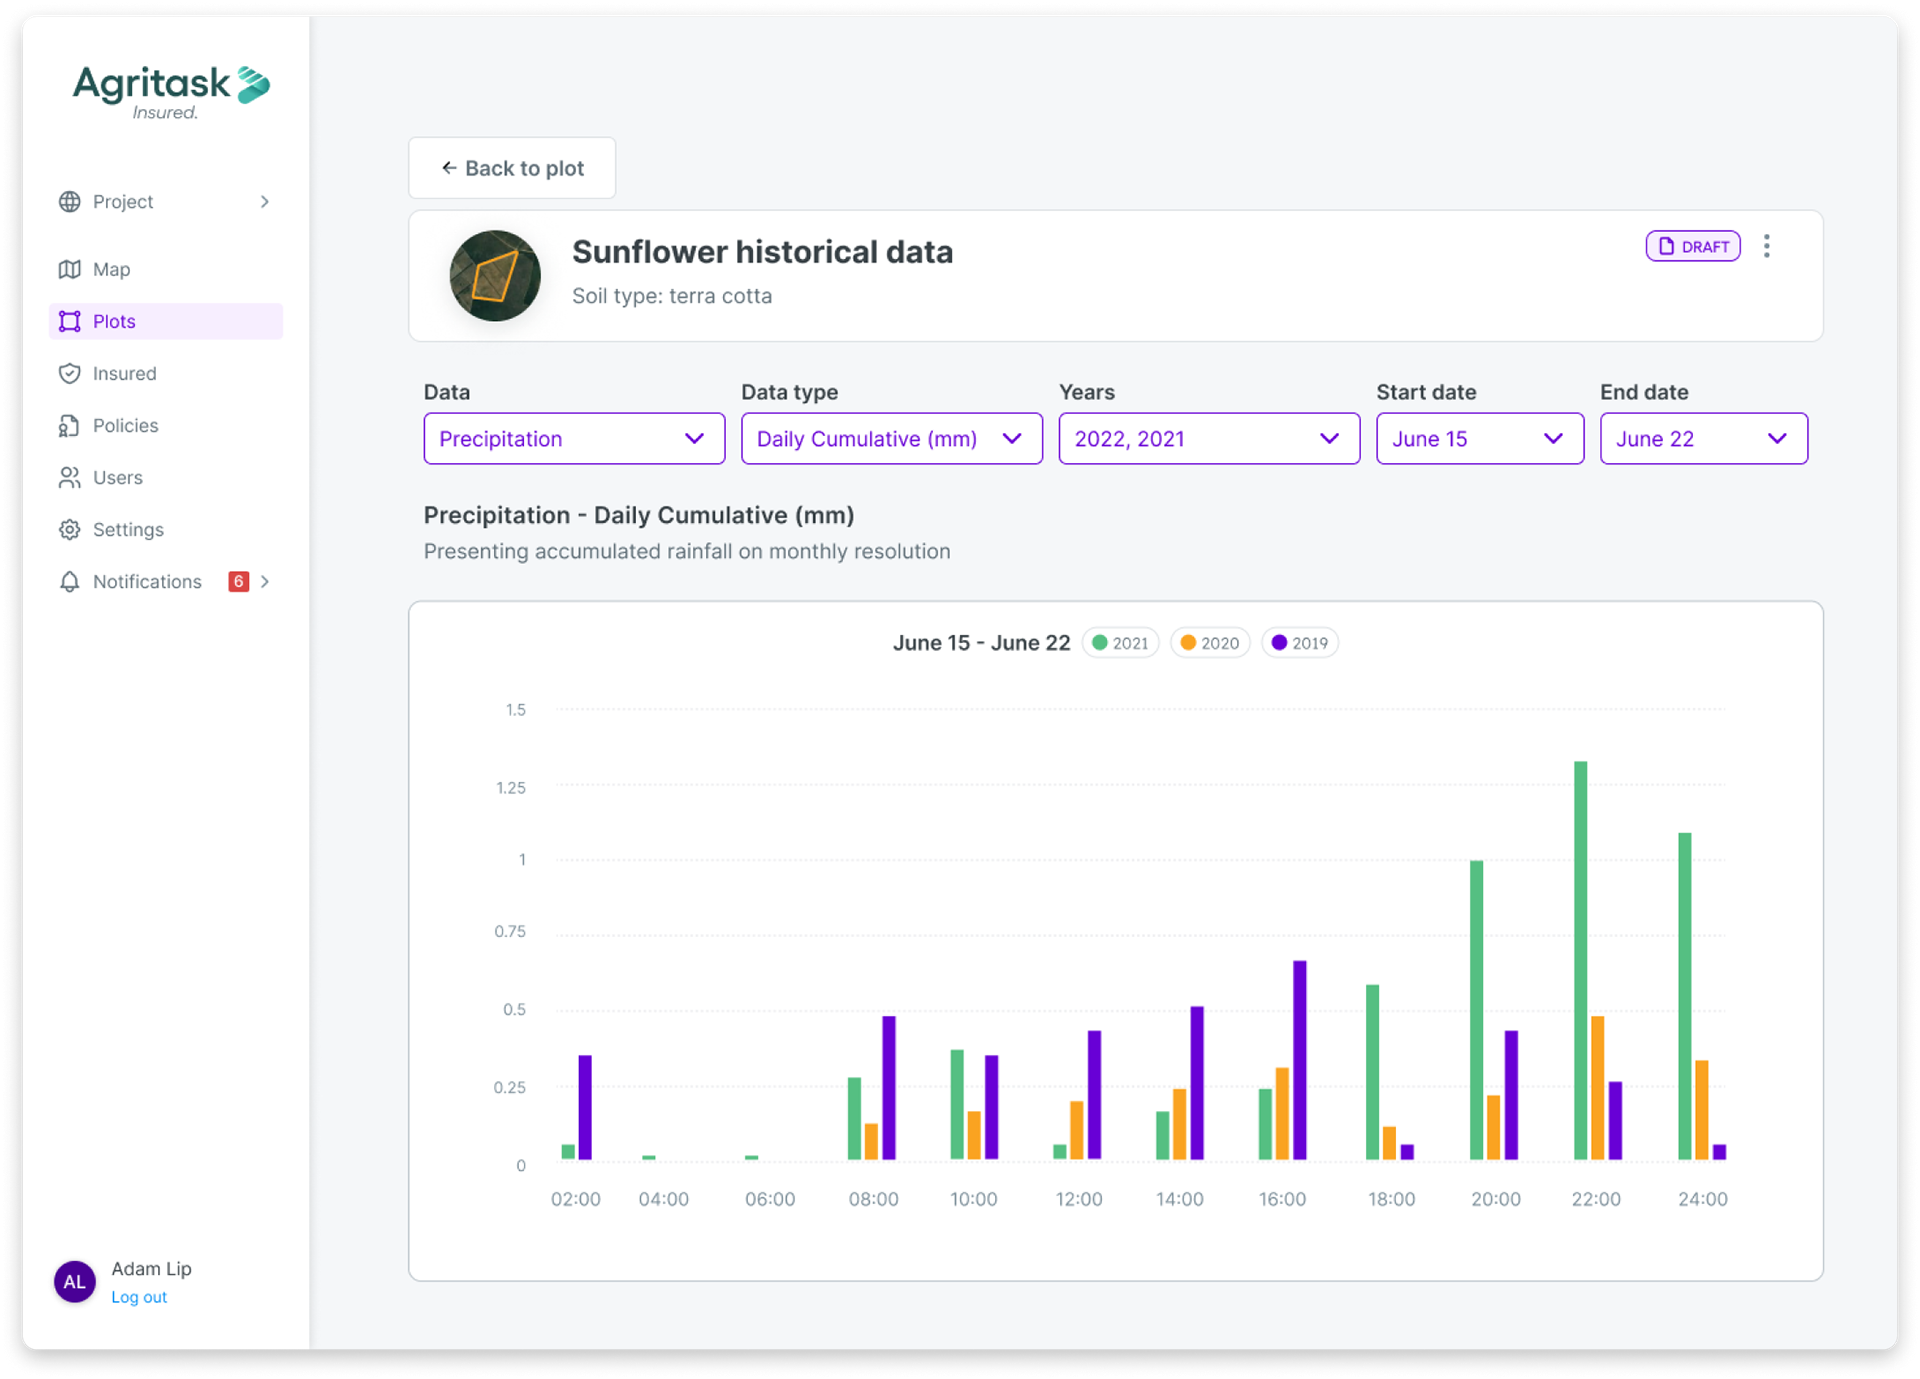
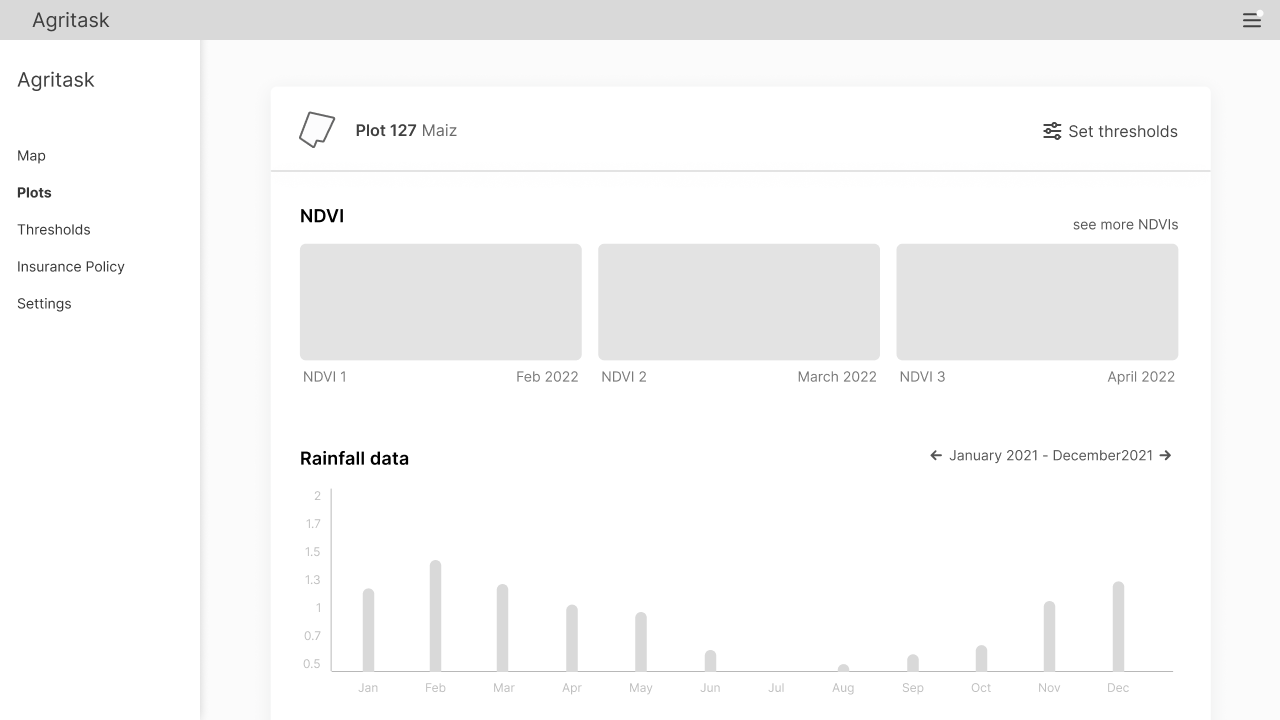
Plot analysis and historical risk data
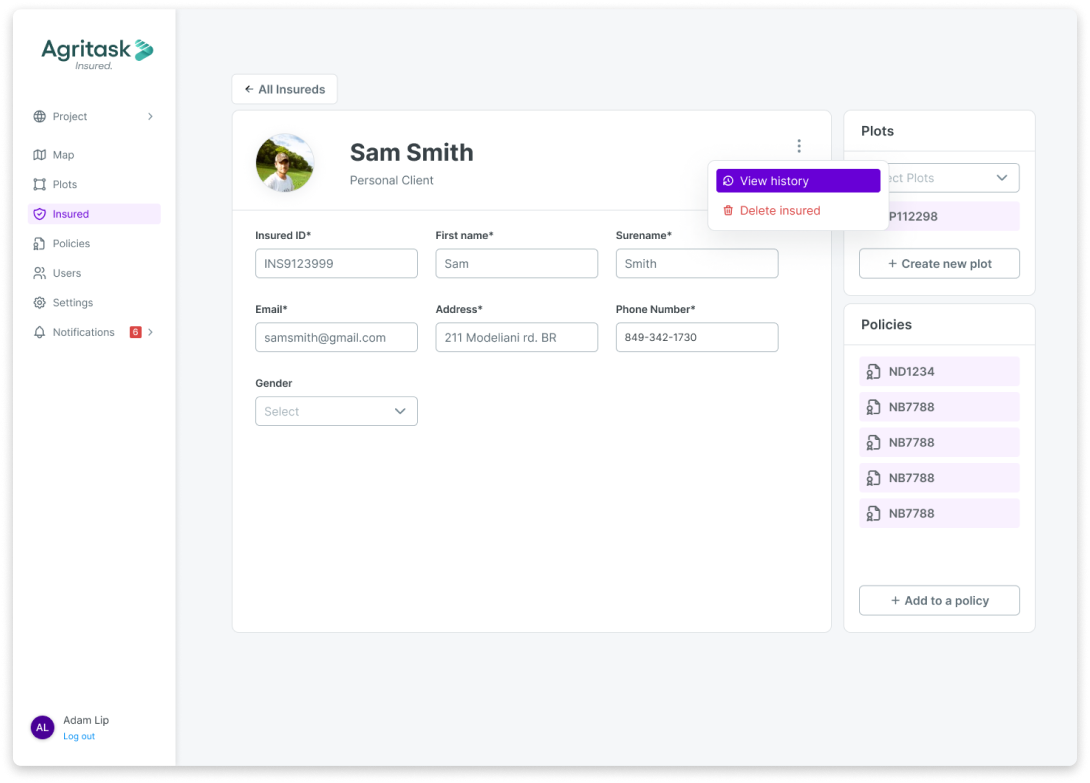
Insureds
A table view which contains all the contact info of clients.
Via the the client page, the user can edit information and connect plots and policies to a client.

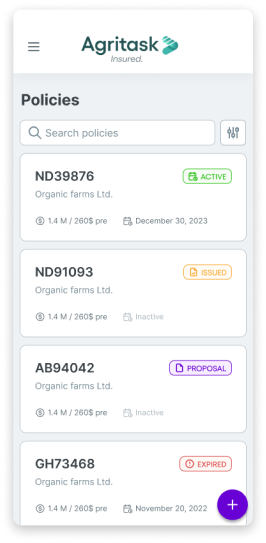
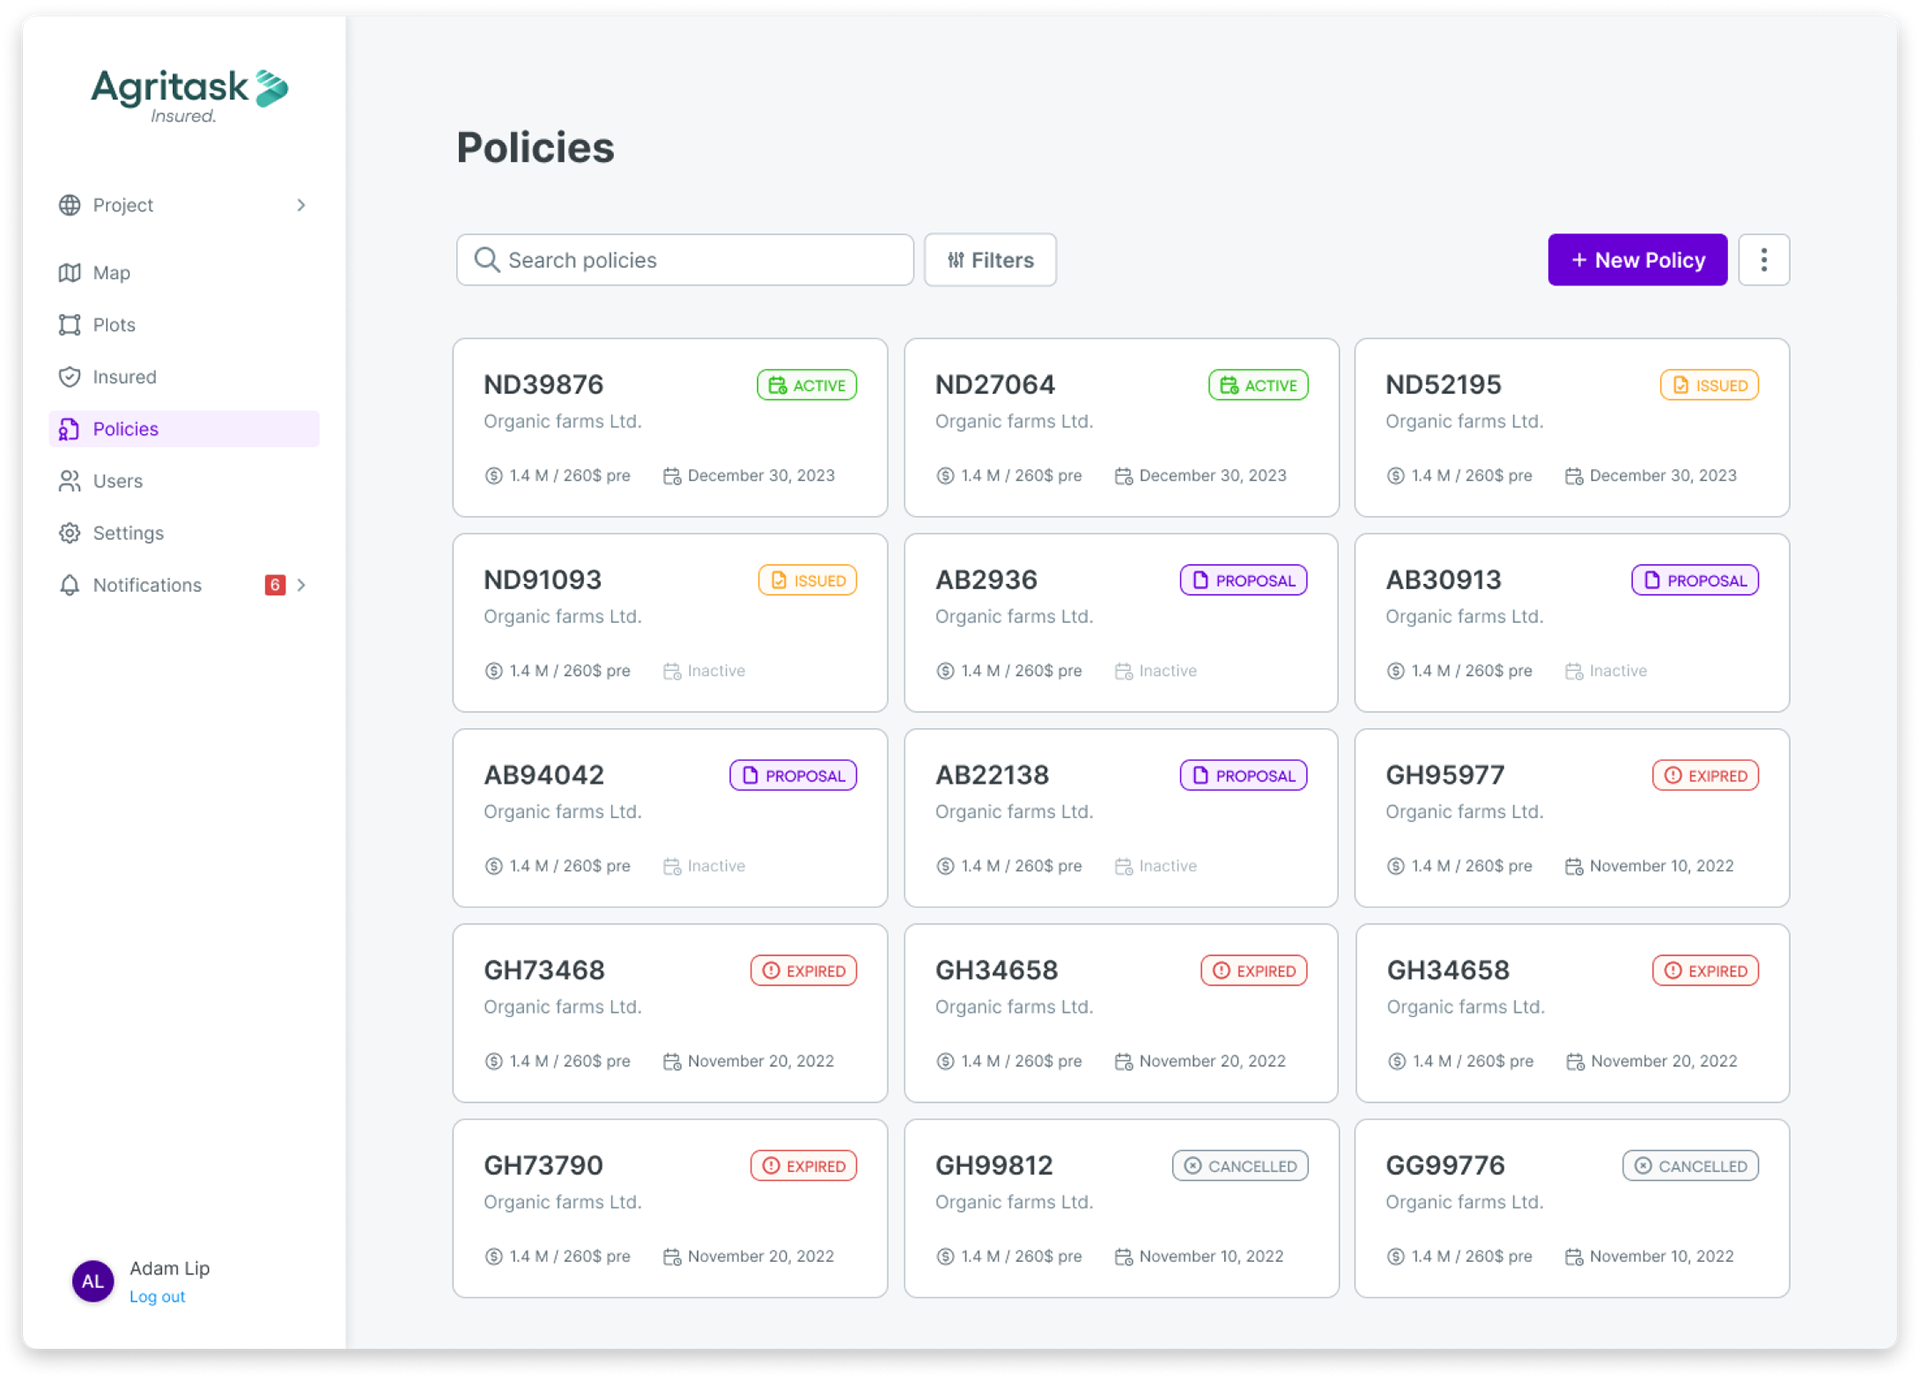
Policies
The policies page includes all policies in all statuses.
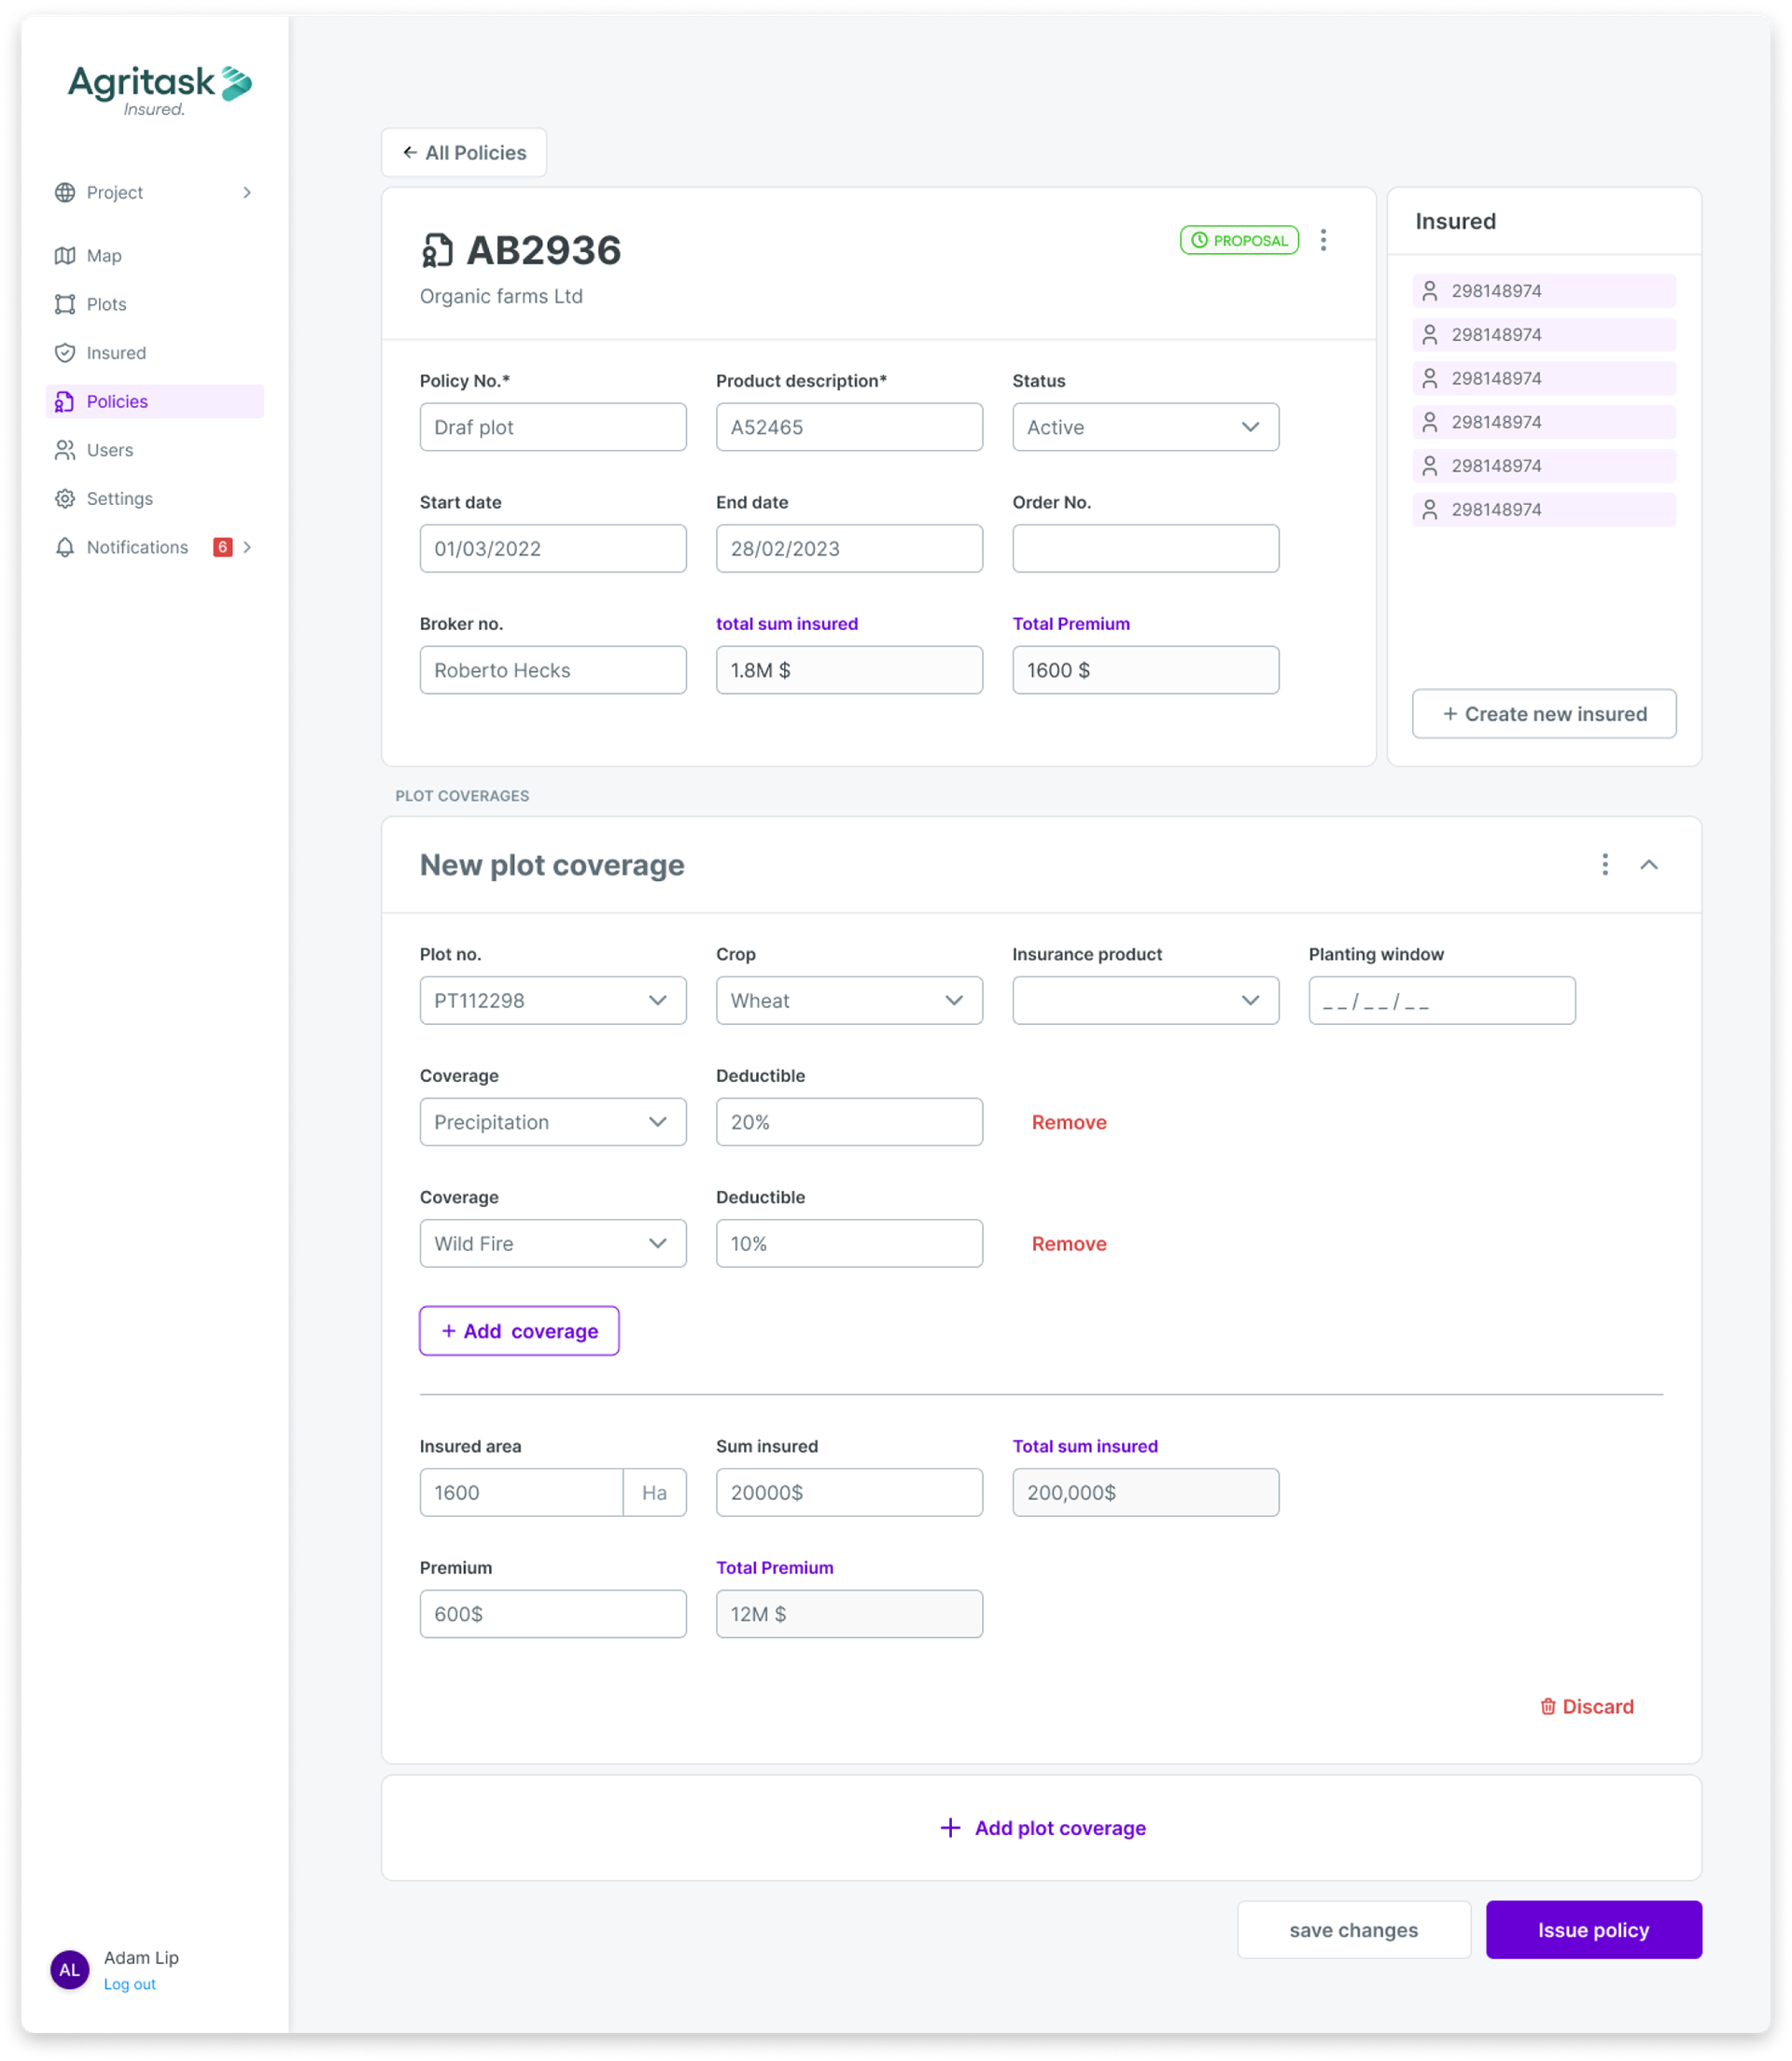
Once a policy is drafted the underwrites may start adding coverages. The coverages are the list of potential disasters that may occur in the field. The client may add as many coverages as needed and select the precentage of cover the insurance company is responsible for in case of damage. This eventually will translate into monthly payments and premium amount.
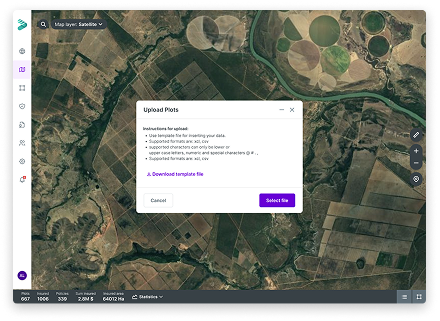
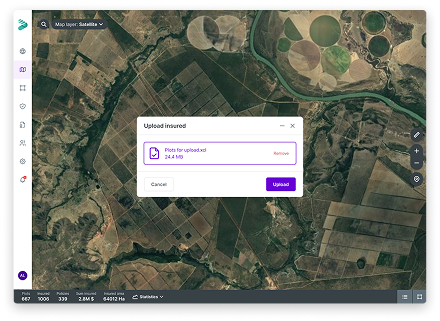
Batch upload
The system allows uploading data in batches. The user may upload a list of plots (polygons) or insureds.
In order to help the user upload xcl files easily without errors,
the system provides a template file for the user to fill and upload back into the system.
the system provides a template file for the user to fill and upload back into the system.
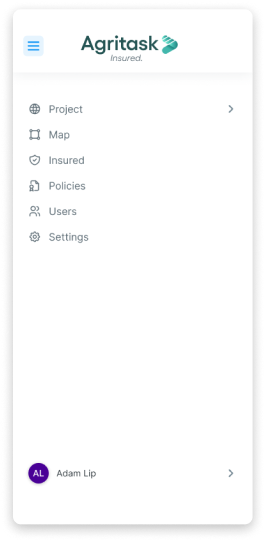
Mobile view
The mobile view is a responsive vie of the desktop app. It allows users to access all data while on the field, as well creating new plots and preform an audit online.